
Return on invest

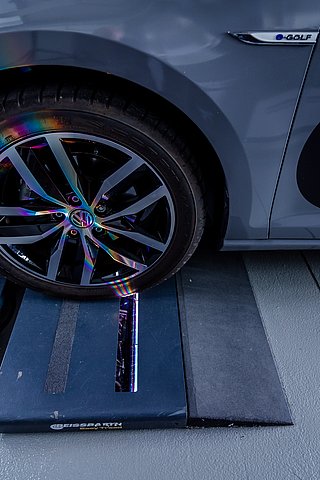
Tyre Scanner

Customer vehicles per day
Scanning every vehicle for: Wheel Alignment Check Tread Depth Check
Typical Failure Rate 1
New service opportunities 2
per Day
Customer Acceptance Rate
Additional service jobs per day
Profit per service job
Additional Net Profit per day
Yearly Net Profit 3
Equipment Investment 4
Equipment Payback months

Download as PDF

Right now, you are letting in annual alignment profit drive out of your bay unnoticed!

Every day, customers leave your shop with potential safety problems they don't even know they have.

minutes of working time saved per day from not having to scan tyre profiles manually.

Your shop would require wheel alignment bays wheel alignment bay to handle this number of daily alignments.

1 Typical failure rates based on experience with numerous customer installations
2 For a conservative calculation, the replacement of a single tire was assumed. Typically, tires are replaced by axle or, for vehicles with all-wheel drive (AWD/4WD), four at a time
3 Payback period for the system = (system cost) / (vehicles per day × downtime rate × customer acceptance rate × profit per service visit × 250 working days per year)
4 Additional costs for concrete work and on-site installation are not included in the equipment price
5 Manual tread depth checks take about 3 minutes per vehicle
6 With a Q.Lign wheel alignment system, up to 20 wheel alignments can be performed daily

The calculated values are non-binding examples and do not guarantee actual savings or payback periods. Actual profitability depends on your individual circumstances. No liability is assumed for the accuracy of these estimates.